Интернеттегі барлық стриминг калькуляторлар бірдей жұмыс істейді. Тыңдалым санын енгізесің, ол тұрақты мөлшерлемеге көбейтіледі де — доллармен сома шығады. Spotify: $0.004. Apple Music: $0.008. Болды. Келесі.
Мәселе мынада: бұл мөлшерлеме — жалған.
Мен музыка шығарамын. UnitedMasters арқылы дистрибуция жасаймын — Spotify, Apple Music, YouTube және тағы бірнеше платформа. Тоғыз ай бойы нақты төлемдер жиналды — және олар кез келген калькулятор көрсеткеннен мүлдем басқа суретті сипаттайды.
Деректер не көрсетеді
Біздің Spotify-дағы бір тыңдалымға мөлшерлеме тоғыз айда 21%-ға өсті — бірнеше мыңнан миллионнан астам ай сайынғы тыңдалымға дейін өскен сайын. Себебі Spotify ірі әртістерге көбірек төлейді деген емес — платформаға сенің көлемің маңызды емес. Мәселе — кім тыңдап жатқанында.
Spotify Premium жазылушылары платформаның жалпы табысының шамамен 90%-ын құрайды, ал тегін нұсқа пайдаланушылары — бар болғаны 10%-ын. Premium тыңдаушының бір тыңдалымы тегін пайдаланушынікінен 3–4 есе көп ақша әкеледі. Сен кішкентай болып, тыңдалымдарың негізінен алгоритмдік плейлисттер мен Discover Weekly-ден келгенде, аудиторияң тегін пайдаланушыларға ауады. Өскен сайын — адамдар саған жазылып, тректеріңді сақтап, саналы түрде қайта оралған кезде — аудиториядағы Premium үлесі жоғарылайды. Тыңдалым мөлшерлемесі оған ілеседі.
Бірде-бір калькулятор мұны ескермейді. Бәрі бір санды қолданады.
Мен мұны Claude көмегімен табыс болжау моделін құрып жатқанда анықтадым — Spotify for Artists-тен CSV-лер жүктеп, UnitedMasters әмиянындағы төлемдермен салыстырып, әр платформаның мөлшерлемелері бойынша регрессиялар жүргіздім. Бір-екі күн шоғырланған жұмыс алды. Модель ай сайынғы табысты 5%-дан аз қателікпен болжайды, нақты деректерге тексерілген. «Сандар неге сәйкес келмейді?» деген сұрақтан басталған нәрсе үшін жаман емес.
Сонымен қатар, мен бұрыннан күдіктенген нәрсені дәлелдедік: төлем кідірісін. N айдағы тыңдалымдар әмияныңда тек N+2 айда пайда болады. Мұны нақты тексердік — бірінші тыңдалымнан бірінші төлемге дейін дәл 49 күн өтті. Содан бері әр ай сол схеманы қайталайды. Бұл туралы да бірде-бір калькулятор айтпайды.
Ешкім жауап бермейтін үш сұрақ
Мен кез келген тәуелсіз әртістің үш негізгі сұрағына жауап бере алатын құрал іздедім:
Бірінші — менің масштабымда тыңдалымдарымнан қанша табыс табамын? Блогтағы орташа мәнді емес. Аудитория құрамының мөлшерлемеге әсер ететінін ескеретін сан.
Екінші — ақша қашан келеді? Бүгін тыңдалымдар жинадым. Қолма-қол ақшаны қашан көремін? Қай дистрибьютор ең жылдам?
Үшінші — маған айына $1 000 керек. Мақсатқа жету үшін әр платформада қанша тыңдалым керек?
Бірде-бір құрал үшеуіне де жауап бермеді. Көпшілігі біріншісіне әрең жауап берді — және бір тұрақты мөлшерлемені қолдану арқылы қателесті.
Сондықтан мен howmuchperstream.com жасадым.
Ол не істейді
Бір бетте үш құрал.
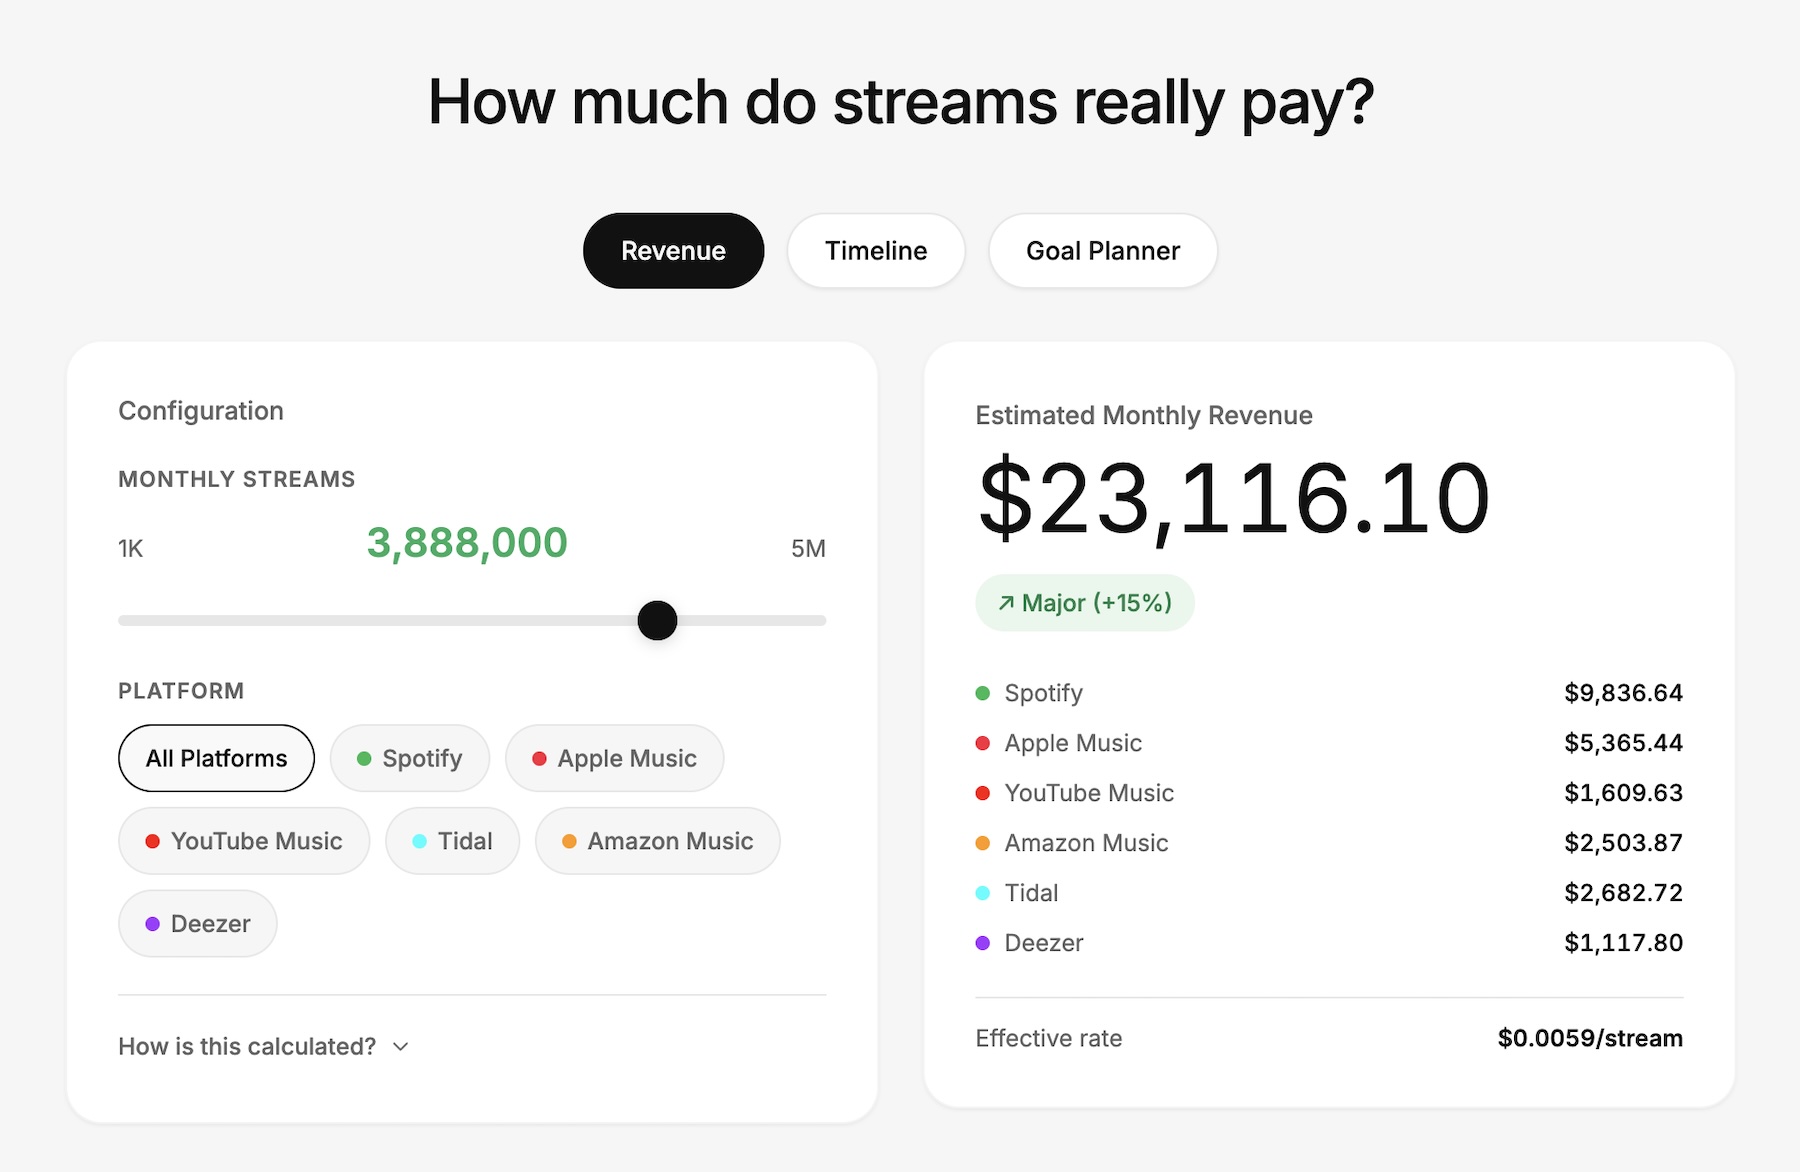
Табыс калькуляторы ай сайынғы тыңдалым санын және платформаны алады, содан кейін базалық мөлшерлемеге көлемге байланысты коэффициент қолданады. Микро-әртістер (10 мыңнан аз тыңдалым) төмен коэффициент алады — олардың аудиториясы тегін жазылымға және кездейсоқ табуларға ауған. Миллионнан жоғары әртістер жоғары коэффициент алады — көбірек адал жанкүйерлер, көбірек Premium тыңдаушылар. Коэффициенттер тексерілген төлемдердің тоғыз айына калибрленген. Алты платформаны қамтиды: Spotify, Apple Music, YouTube Music, Tidal, Amazon Music және Deezer.
Төлем хронологиясы ақшаңыздың қашан жететінін дистрибьюторлар бойынша көрсетеді. UnitedMasters, DistroKid, TuneCore немесе тоғыз дистрибьютордың кез келгенін таңдаңыз — толық жолды көріңіз: тыңдалымдар жиналды → DSP есеп беру кідірісі → дистрибьютор өңдеуі → ақша әмиянда. Нақты күн диапазондарымен, бұлдыр «2–3 ай» емес.
Кері мақсат калькуляторы тыңдалымдар бойынша есептейді. Айына $1 000 керек екенін айтасың, платформалар бойынша бөлуді таңдайсың (Spotify басым, теңгерілген немесе Apple басым) — және ол әр платформа бойынша қажетті тыңдалымдарды есептейді. Итеративті шешімшіні қолданады, өйткені дөңгелек тәуелділік бар — көбірек тыңдалымдар сені жоғары тирге көтереді, бұл мөлшерлемені өзгертеді, бұл қажетті тыңдалымдар санын өзгертеді. Шешімші 1–2 итерацияда жинақталады.
Қалай жасадым
Дизайн — Variant-тан. Вайб-дизайн туралы постымда сипаттаған процестің өзі. Мокаптар пачкасын генерациялап, Claude-қа UX тәжірибесі бойынша бағалаттым, ең жақсы элементтерді біріктірдім. Екі макет шықты: десктоп үшін таза Stripe стилі (ақ фон, екі бағанды карталар, минимализм) және мобильді үшін Spotify-for-Artists стилі (үлкен сандармен қараңғы жоғарғы бөлік, басқару элементтерімен ақ төменгі парақ).
Код — React, Claude-мен жазылған. Бір компонент файлы екі макетті де өңдейді — экран енін анықтап, сәйкесін рендерлейді. Мөлшерлемелер, коэффициенттер және дистрибьюторлардың кідіріс уақыттары файлдың басындағы бір конфигурациялық объектіде жатыр. Мөлшерлемелерді тоқсан сайын жаңарту — алты санды ауыстыру.
Lovable-да хосттадым — бірнеше минутта деплой, диалогта итерациялар. Бэкендсіз, дерекқорсыз, авторизациясыз. Бәрі клиент жағында жұмыс істейді.
Бәрі — спецификация, дизайн, код, тестілеу — бір күн алды. Мұны мүмкін еткен тоғыз ай бойғы деректер жинау тоғыз ай алды.
Неліктен басқаша
Мен тапқан кез келген стриминг калькулятор бір көбейту жасайды. Тыңдалымдар × мөлшерлеме = ақша. Тұрақты мөлшерлеме, контекстсіз, түсіндірмесіз.
Біздікі аудитория құрамын ескереді (көлем тирлері Premium тыңдаушылар үлесінің проксиі ретінде), ақшаның қашан келетінін көрсетеді (дистрибьюторлардың нақты деректерімен төлем хронологиясы) және мақсаттан кері есептейді (итеративті кері калькулятор). Әдістеме бөлімі әр санның қалай есептелетінін нақты түсіндіреді — қара жәшік жоқ.
Тир моделі — басты айырмашылық. Spotify ірі әртістерге көбірек төлемейді. Бірақ ірі әртістердің басқа аудиториясы бар — саналы тыңдаушылар көбірек, Premium жазылушылар көбірек, жоғары табысты нарықтардан тыңдалымдар көбірек. Нәтижесінде тиімді мөлшерлеме өзгереді. Өзгеріс — нақты, өлшенетін және мансапты жоспарлау кезінде маңызды.
Бизнес-модель
Сайт тегін. Тіркелусіз, пейволлсыз.
Табыс — дистрибьюторларға серіктестік сілтемелерден. Мен әр ірі дистрибьюторды тексердім — көпшілігі серіктестік бағдарламаларын тыныш жапқан. TuneCore 2023 жылы жапты, CD Baby да жапты, Amuse-де жоқ. Нақты жұмыс істейтін бағдарламалар тек екеуінде: DistroKid (реферал үшін $10) және Ditto Music (тіркелгені үшін $10-ға дейін). UnitedMasters-те реферал жүйесі бар, бірақ лимиттермен және тек платформаның қазіргі әртістері үшін — классикалық серіктестік емес.
Схема қарапайым: әртіс әлеуетті табысын есептейді, төменде «Дистрибуцияға дайынсыз ба? Нұсқаларды салыстырыңыз» деп көреді, DistroKid немесе Ditto сілтемесін басады. Конверсия табиғи — адам стриминг ақшасы туралы білуге келді, келесі қисынды қадам — дистрибьюторды таңдау. Барлық тоғыз дистрибьютор калькуляторда толықтық пен сенімділік үшін қалады, бірақ серіктестік сілтемелер тек нақты жұмыс істейтін бағдарламалары барларға қойылады.
Екінші қабат: SEO-контент. «How much does Spotify pay per stream» айына ондаған мың рет ізделеді. Осы сұраулар бойынша мақалалар калькуляторға органикалық трафик тартады. Трафик жеткенде блогта Google AdSense немесе Mediavine.
Үшінші қабат — болашаққа: әдістеме беті сенімділікті құрады. Егер сайт стриминг мөлшерлемелері бойынша сенімді дереккөзге айналса, демеушілік орналастырулар, салалық есептер мен аналитикалық компаниялар үшін API жолы ашылады. Бірақ бұл бір жылдан кейін. Әзірге — екі серіктестік сілтеме мен шыдамдылық.
Жалпы инвестиция: бір домен (жылына $10) және хостинг (Lovable-да тегін). Тәуекел: нөл.
Нені басқаша жасар едім
Мөлшерлеме деректері олардың көздері қаншалықты жақсы болса, соншалықты жақсы. Біздің жеке төлем деректеріміз — тексерілген және нақты, бірақ бұл бір жоба, бір дистрибьютор, бір нарық жиынтығы. Бізде бірінші тараптық деректер жоқ платформалар (Tidal, Amazon, Deezer) бойынша салалық орташа мәндер жарияланған есептерден және қоғамдастық деректерінен алынған. Олар ақылға қонымды бағалаулар, бірақ абсолют шындық емес.
Шын мәнісінде күшті қадам — әртістерден деректерді краудсорсинг жасау. «Төлем деректеріңізді жіберіңіз» деген анонимді форма, ол тірі дерекқорды толтырады. Glassdoor сияқты, бірақ стриминг мөлшерлемелері үшін. Бұл — v2 көзқарасы. Әзірге тир моделі мен салалық орташа мәндер — интернетте бар нәрселердің ішінде ең дәлі.
Бүгін жасай алатын бір нәрсе
Кез келген стриминг калькуляторын аш. Spotify-да 100 000 тыңдалымды енгіз. Шамамен $400 шығады.
Енді ойлан: сенің аудиторияң — негізінен алгоритмдік плейлисттер арқылы тапқан тегін тыңдаушылар ма, әлде саналы түрде сені тыңдайтын Premium жазылушылар ма? Егер біріншісі болса, нақты саның $288-ге жақын. Егер екіншісі болса — $460-қа жақын.
Бұл айырмашылық — 100 мың тыңдалымда $172 — мансап құрып жатқанда маңызды. Миллион тыңдалымда бұл $3 200 мен $4 600 арасындағы айырмашылық.
Тұрақты мөлшерлемелі калькулятор саған $400 деп айтты, сен сендің. Нақты сан кім тыңдап жатқанына байланысты.
howmuchperstream.com — байқап көр, бөліс, не бұзылғанын айт.